
Set Your View
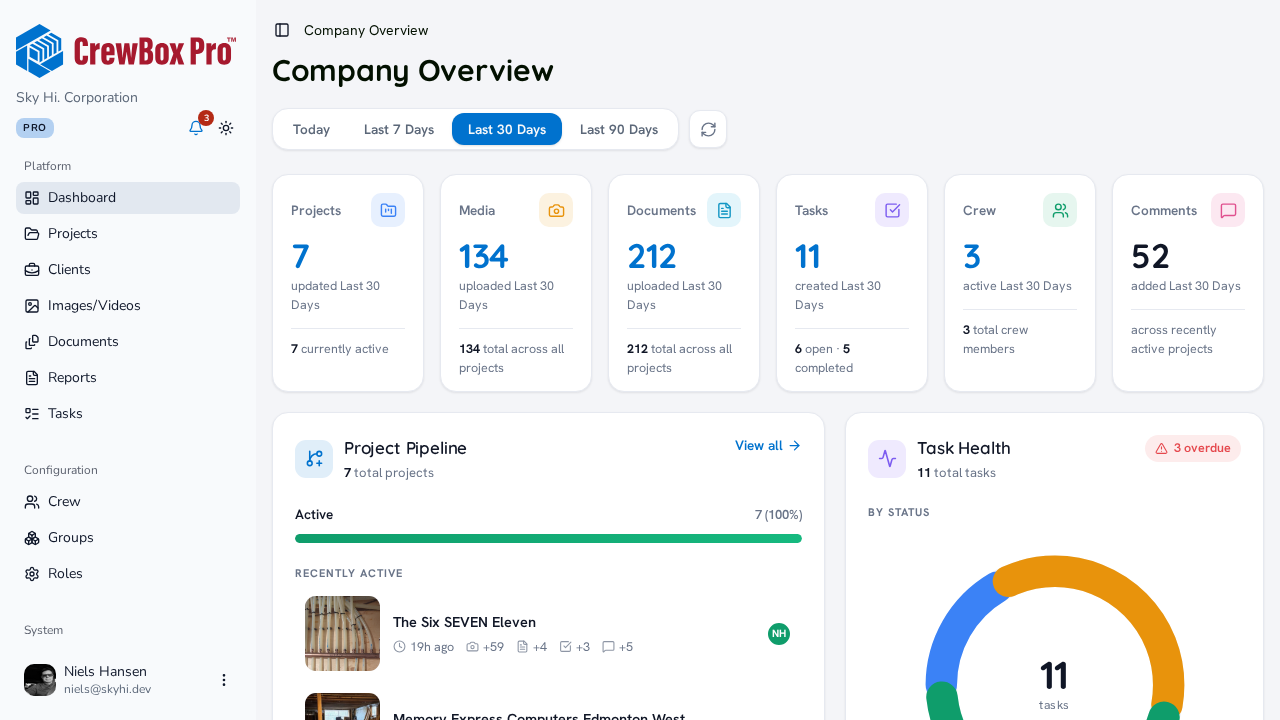
At the top of the Dashboard, pick a period — Today, Last 7 Days, Last 30 Days (default), or Last 90 Days — and every widget rescopes to it. Click the refresh button any time to re-pull all dashboard data.
KPI Cards
Six headline cards summarize the period: Projects, Media, Documents, Tasks, Crew, and Comments. Each shows a period stat plus an all-time footer stat, and all but Comments are click-through links — click Media, for example, to open the Images page.
Project Pipeline
An active-projects progress bar shows how much of your portfolio is active, followed by a Recently active list (10 per page): thumbnail, name and address, last-updated time, per-period activity icons (photos, documents, tasks, comments), and up to three assigned-crew avatars. Click any row to open that project.
Task Health
A status donut chart (Backlog / To Do / In Progress / Done) with the total in the center, priority meter bars (Low / Medium / High / Urgent), a red "N overdue" pill when tasks are overdue, and created/completed counts for the period.
Media & Document Activity
Two parallel widgets, each with a By project top-five list and a paginated recent-items list:
- Recent photos open in the photo viewer with the comments panel already open.
- Recent documents show a type-colored icon, uploader, time, and file size, and open the file directly in a new tab.
Crew Overview
Your most active crew members this period: avatar, name, role, last-active time, per-period photo/document/task counts, and a total-tasks pill. Click a row to open that crew member's page.
Recent Comments
The latest team comments across active projects, labeled by what they're on (a photo, document, task, blueprint, or the project) and deep-linked to the exact conversation.
Upcoming Deadlines
Tasks due within the selected period, each with a due-date pill (red when due today), a priority pill, and assignee avatars. Click a deadline to open the task in the edit dialog right on the dashboard — triage without leaving the page.